


Here are 5 reassuring facts around market volatility:
1) Volatility may be uncomfortable … but it’s normal.
Just like muscle fatigue is part of any intense training program, volatility is an unavoidable part of the investment process as well. It’s easy for investors to forget that volatility is the norm, not the exception, when stock prices steadily rise or fluctuate less than 1% per day. According to market data, stocks have averaged three pullbacks of 5 - 10% per year, and since 1980 the S&P 500 experienced 25 corrections of more than 10%, and it has historically recovered. In addition to explaining the regularity of dips throughout a decades-long investment experience, it’s equally important to emphasize what typically happens in the period following a dip. According to Ned Davis Research, the average return from the lows after a correction exceeds 23% over the next year, which can be a comforting fact to investors who are seeing their account values drop.[Figure 1]
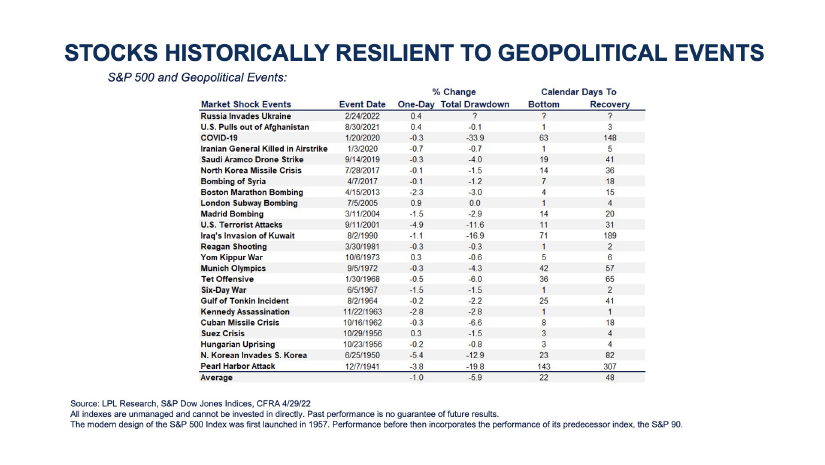
Additionally, we’re living in extraordinary times and while we haven't faced these exact economic and geopolitical issues before, the market has faced others and eventually, the turbulence ended positively. While it’s never pleasant to watch stock prices fall, if the investor can see it as an expected part of the investment journey, then the fluctuations may cause less angst.[Figure 2]
Figure 1
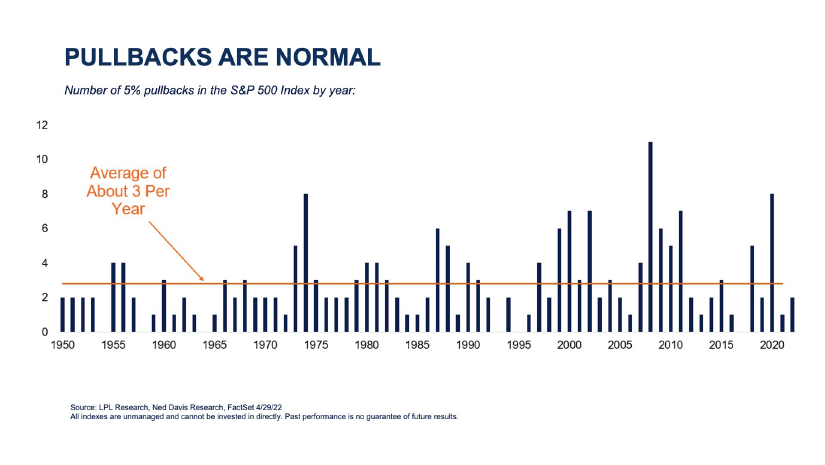
Figure 2
2) Patient investors are typically rewarded
While investing in equities offers the opportunity to profit from innovation, economic progress, and compound growth, it also requires a lot of patience and time to pursue gains. Investing in the stock market is “a way for the impatient to transfer money to the patient,” asWarren Buffett famously once said.2
History shows that patience has indeed paid off:
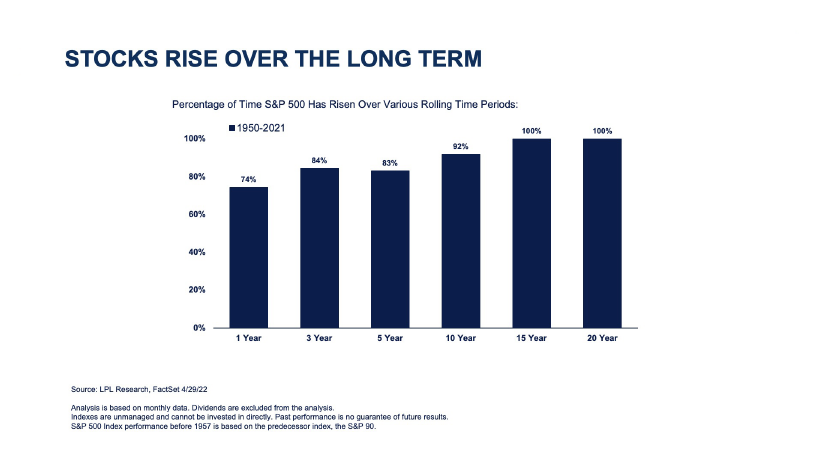
Since 1990, the Dow Jones Industrial Average has achieved 9.5% annualized gains, including dividends. Even if you were to look at shorter time horizons since 1950 the S&P 500 has risen 83% of the time across a five-year horizon, 92% across 10-year periods, and 100% of all rolling 15-year periods.[Figure 3]
Figure 3
And while history cannot guarantee future performance, it can provide insight into the cost of prematurely exiting the market:
From 1990 to 2020, the S&P 500 Index’s annualized gain was 7.5% but the average equity investor’s return was only 2.9%.3Why the 4.6% gap in performance? Because when stock prices begin to fall, investors become driven by fear, which drives them to sell even though it may not be in their best interest.
In addition to providing a long-term historical perspective, it may also help them to remind investors of their time horizon. Once they established a long-term goal, they embarked on a journey to pursue that goal. And although the journey may not always be pleasant, there are no shortcuts that allow them to skip over rough terrain.
3) Timing the market doesn’t work
Investors are naturally inclined to protect their portfolio from additional losses by selling on the slide and re-entering when they feel it’s a safe time to reinvest. And though it may seem tempting to time the market this way, it’s usually a costly mistake. Even the most seasoned investor can't predict when a stock has reached its peak or its bottom. During a market decline, if the investor sells out of fear of losing more, the decision of when to re-enter will be equally challenging because re-entering at the wrong time locks in the investor's losses.
From 1990 to 2020, the market's largest gains (and losses) occurred within days of each other. Despite "bad" markets, good days are more common than one might think. For example, consider geopolitical events. Stocks typically rise after negative geopolitical events occur, contrary to what most investors believe. Investors moving to cash on those days risk missing out on some of the market’s best days as stocks “climb the wall of worry,” as the old stock market adage goes.
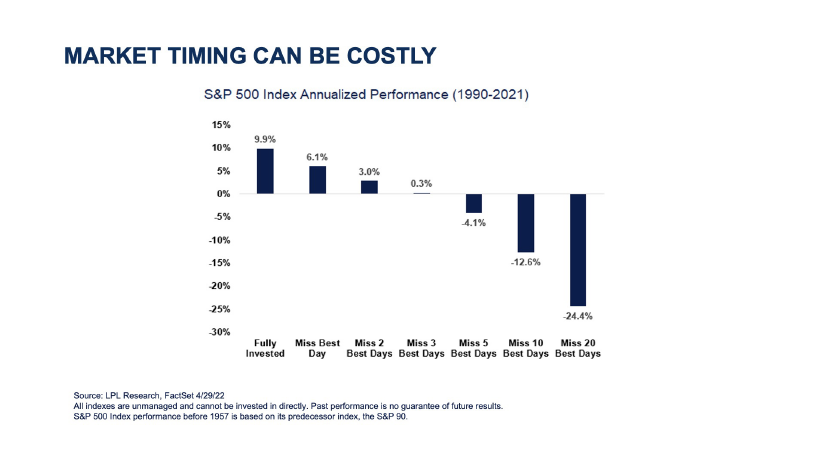
For example, the annualized gain for the S&P 500 from 1990 to 2021 was 9.9%. Yet, if the investor missed only the best day of each year, that annualized return dropped to 6.1%, a difference of 3.8%. If they missed the best two days of each year, they would be up less than 3% annually. Taking it to the extreme, if the investor missed the best 20 days of each year, they would be down 24.4% per year.[Figure 4]
Figure 4
4) Opportunities are everywhere during volatility
When stocks decline, investors can buy in at a lower price and position themselves for future gains. When the decline is part of an overall cycle, stocks trade below their intrinsic values and offer an improved price-to-earnings ratio.
When seen as an opportunity to buy valuable assets at fire-sale prices (when the market is down, investors can get more for their money on individual stocks and equities), investors can begin to reframe their experience and think of it from both the buying and selling angles. Selling may cause the investor to lose capital or to miss out on days where the market makes and holds on to its gains, whereas buying could position the investor better for long-term success.
5) Dollar-cost averaging (and other strategies) can smooth the experience
As investors may know from their experience investing in a 401(k), dollar-cost averaging can potentially reduce the overall impact of price volatility and lower the cost per share. While not as thrilling as receiving big gains over a short time, dollar-cost averaging can help investors maintain discipline during downward cycles.
Contributing the same amount of money into the same position on a regular basis, regardless of how the market is performing, is the opposite of trying to get in and out at the “right” time. As a result, dollar-cost averaging can be an effective and reassuring strategy for those who want to invest despite uncertainty. This can help avoid miscalculations in timing, remove emotion from the equation, provide a smoother investment journey, and help keep long-term goals in focus.
1Source:“High Volatility Creates Demand for Investment Advice,” Cerulli, (July 2022).
3Source: LPL Research, Bloomberg, DALBAR, ClearBridge Investments 6/30/21
IMPORTANT DISCLOSURES
This material is for general information only and is not intended to provide specific advice or recommendations for any individual. There is no assurance that the views or strategies discussed are suitable for all investors or will yield positive outcomes. Investing involves risks including possible loss of principal. Any economic forecasts set forth may not develop as predicted and are subject to change.
References to markets, asset classes, and sectors are generally regarding the corresponding market index. Indexes are unmanaged statistical composites and cannot be invested into directly. Index performance is not indicative of the performance of any investment and does not reflect fees, expenses, or sales charges. All performance referenced is historical and is no guarantee of future results.
Any company names noted herein are for educational purposes only and not an indication of trading intent or a solicitation of their products or services. LPL Financial doesn’t provide research on individual equities.
All information is believed to be from reliable sources; however, LPL Financial makes no representation as to its completeness or accuracy.
U.S. Treasuries may be considered “safe haven” investments but do carry some degree of risk including interest rate, credit, and market risk. Bonds are subject to market and interest rate risk if sold prior to maturity. Bond values will decline as interest rates rise and bonds are subject to availability and change in price.
The Standard & Poor’s 500 Index (S&P500) is a capitalization-weighted index of 500 stocks designed to measure performance of the broad domestic economy through changes in the aggregate market value of 500 stocks representing all major industries.
The PE ratio (price-to-earnings ratio) is a measure of the price paid for a share relative to the annual net income or profit earned by the firm per share. It is a financial ratio used for valuation: a higher PE ratio means that investors are paying more for each unit of net income, so the stock is more expensive compared to one with lower PE ratio.
Earnings per share (EPS) is the portion of a company’s profit allocated to each outstanding share of common stock. EPS serves as an indicator of a company’s profitability. Earnings per share is generally considered to be the single most important variable in determining a share’s price. It is also a major component used to calculate the price-to-earnings valuation ratio.
The PCE Price Index Excluding Food and Energy, also known as the core PCE price index, is released monthly. The core index makes it easier to see the underlying inflation trend by excluding two categories – food and energy. – where prices tend to swing up and down more dramatically and more often than other prices.
The Consumer Price Index (CPI) is a measure of the average change over time in the prices paid by urban consumers for a market basket of consumer goods and services.
All index data from FactSet.
This research material has been prepared by LPL Financial LLC.
Securities and advisory services offered through LPL Financial (LPL),a registered inv estment advisor and broker -dealer (member FINRA/SIPC). Insurance products are offered through LPL or its licensed affiliates. To the extent you are receiving investment a dvice from a separately registered independent investment advisor that is not an LPL affiliate, please note LPL makes no representation with respect to such entity.
| Not Insured by FDIC/NCUA or Any Other Government Agency | Not Bank/Credit Union Guaranteed | Not Bank/Credit Union Deposits or Obligations | May Lose Value |